Matplotlib 子圖
顯示多個圖
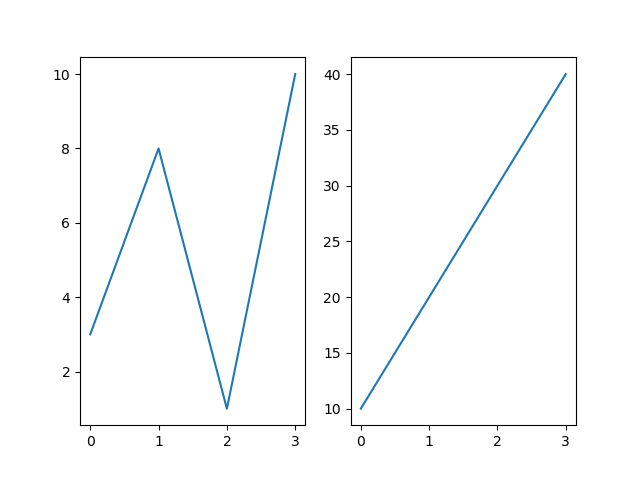
使用 subplot() 函式,您可以在一個圖中繪製多個圖。
示例
繪製 2 個圖
import matplotlib.pyplot as plt
import numpy as np
#圖 1
x = np.array([0, 1, 2, 3])
y = np.array([3, 8, 1, 10])
plt.subplot(1, 2, 1)
plt.plot(x,y)
#圖 2
x = np.array([0, 1, 2, 3])
y = np.array([10, 20, 30, 40])
plt.subplot(1, 2, 2)
plt.plot(x,y)
plt.show()
結果
subplot() 函式
subplot() 函式接受三個引數,用於描述圖形的佈局。
佈局由行和列組織,由第一個和第二個引數表示。
第三個引數表示當前圖的索引。
plt.subplot(1, 2, 1)
#圖形有 1 行,2 列,這是第一個圖。
plt.subplot(1, 2, 2)
#圖形有 1 行,2 列,這是第二個圖。
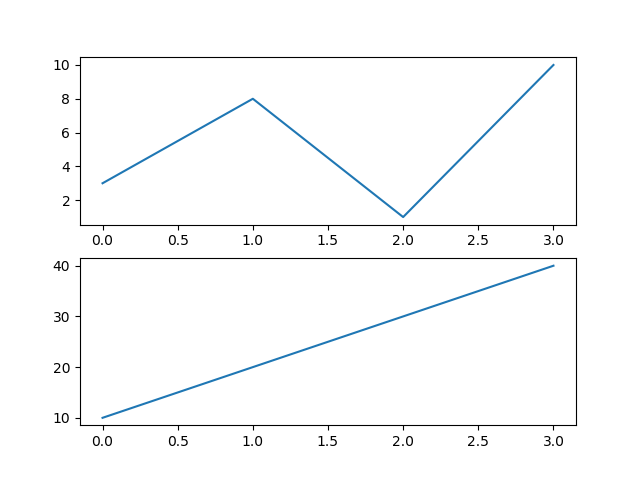
因此,如果我們想要一個有 2 行 1 列的圖形(意味著兩個圖將垂直顯示而不是並排顯示),我們可以這樣編寫語法:
示例
將 2 個圖垂直顯示
import matplotlib.pyplot as plt
import numpy as np
#圖 1
x = np.array([0, 1, 2, 3])
y = np.array([3, 8, 1, 10])
plt.subplot(2, 1, 1)
plt.plot(x,y)
#圖 2
x = np.array([0, 1, 2, 3])
y = np.array([10, 20, 30, 40])
plt.subplot(2, 1, 2)
plt.plot(x,y)
plt.show()
結果
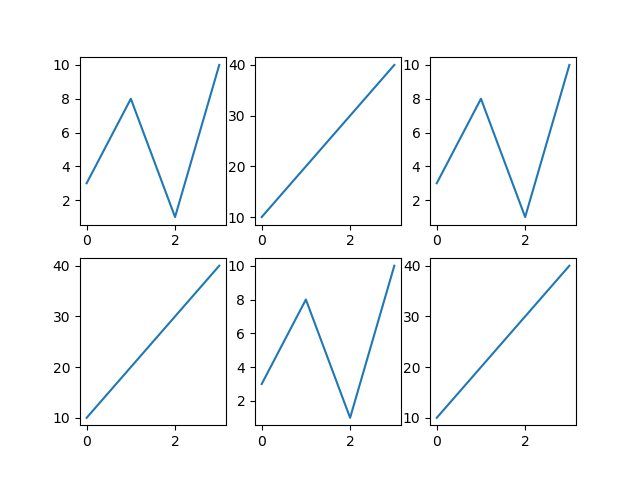
您可以在一個圖形上繪製任意多張圖,只需描述行數、列數和圖的索引即可。
示例
繪製 6 個圖
import matplotlib.pyplot as plt
import numpy as np
x = np.array([0, 1, 2, 3])
y = np.array([3, 8, 1, 10])
plt.subplot(2, 3, 1)
plt.plot(x,y)
x = np.array([0, 1, 2, 3])
y = np.array([10, 20, 30, 40])
plt.subplot(2, 3, 2)
plt.plot(x,y)
x = np.array([0, 1, 2, 3])
y = np.array([3, 8, 1, 10])
plt.subplot(2, 3, 3)
plt.plot(x,y)
x = np.array([0, 1, 2, 3])
y = np.array([10, 20, 30, 40])
plt.subplot(2, 3, 4)
plt.plot(x,y)
x = np.array([0, 1, 2, 3])
y = np.array([3, 8, 1, 10])
plt.subplot(2, 3, 5)
plt.plot(x,y)
x = np.array([0, 1, 2, 3])
y = np.array([10, 20, 30, 40])
plt.subplot(2, 3, 6)
plt.plot(x,y)
plt.show()
結果
Title(標題)
您可以使用 title() 函式為每個圖新增標題。
示例
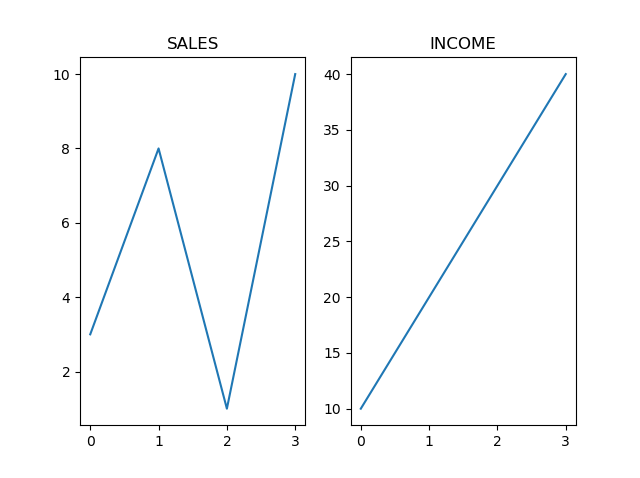
2 個圖,帶標題
import matplotlib.pyplot as plt
import numpy as np
#圖 1
x = np.array([0, 1, 2, 3])
y = np.array([3, 8, 1, 10])
plt.subplot(1, 2, 1)
plt.plot(x,y)
plt.title("SALES")
#圖 2
x = np.array([0, 1, 2, 3])
y = np.array([10, 20, 30, 40])
plt.subplot(1, 2, 2)
plt.plot(x,y)
plt.title("INCOME")
plt.show()
結果
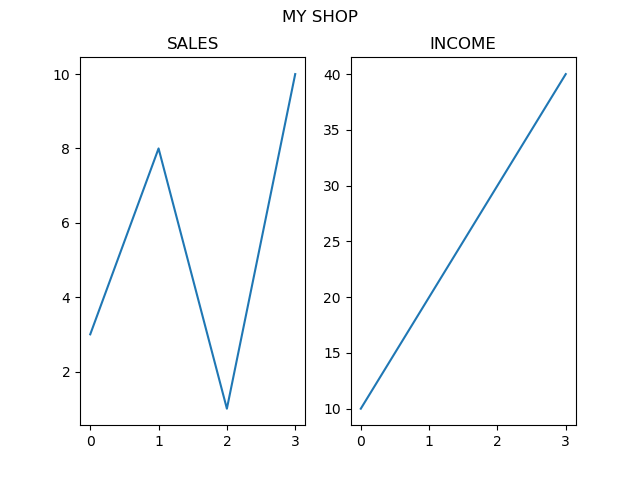
總標題
您可以使用 suptitle() 函式為整個圖形新增標題。
示例
為整個圖形新增標題
import matplotlib.pyplot as plt
import numpy as np
#圖 1
x = np.array([0, 1, 2, 3])
y = np.array([3, 8, 1, 10])
plt.subplot(1, 2, 1)
plt.plot(x,y)
plt.title("SALES")
#圖 2
x = np.array([0, 1, 2, 3])
y = np.array([10, 20, 30, 40])
plt.subplot(1, 2, 2)
plt.plot(x,y)
plt.title("INCOME")
plt.suptitle("MY SHOP")
plt.show()
結果