Seaborn
使用 Seaborn 視覺化分佈
Seaborn 是一個在底層使用 Matplotlib 繪製圖形的庫。它將用於視覺化隨機分佈。
安裝 Seaborn。
如果你已在系統上安裝了 Python 和 PIP,請使用此命令進行安裝
C:\Users\Your Name>pip install seaborn
如果你使用 Jupyter,請使用此命令安裝 Seaborn
C:\Users\Your Name>!pip install seaborn
Distplots
Distplot 代表分佈圖,它以陣列作為輸入,並繪製一個對應於陣列中點分佈的曲線。
匯入 Matplotlib
使用以下語句在你的程式碼中匯入 Matplotlib 模組的 pyplot 物件import matplotlib.pyplot as plt
你可以在我們的 Matplotlib 教程 中瞭解 Matplotlib 模組。
匯入 Seaborn
使用以下語句在你的程式碼中匯入 Seaborn 模組import seaborn as sns
繪製 Distplot
示例
import matplotlib.pyplot as plt
import seaborn as sns
sns.distplot([0, 1, 2, 3, 4, 5])
plt.show()
自己動手試一試 »
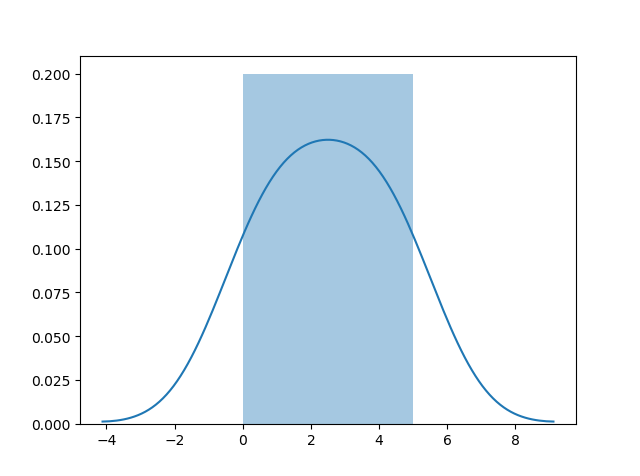
繪製不帶直方圖的 Distplot
示例
import matplotlib.pyplot as plt
import seaborn as sns
sns.distplot([0, 1, 2, 3, 4, 5], hist=False)
plt.show()
自己動手試一試 »
注意: 在本教程中,我們將使用:sns.distplot(arr, hist=False) 來視覺化隨機分佈。