執行 ❯
建立您
自己的
網站
×
更改方向
更改主題,深色/淺色
前往 Spaces
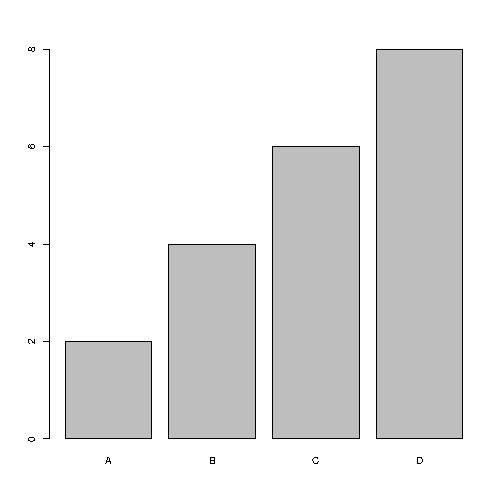
# We need this line of code to show graphs in our compiler bitmap(file="out.png") # x-axis values x <- c("A", "B", "C", "D") # y-axis values y <- c(2, 4, 6, 8) barplot(y, names.arg = x)