執行 ❯
擁有你自己的 Python 伺服器
×
更改方向
更改主題,深色/淺色
前往 Spaces
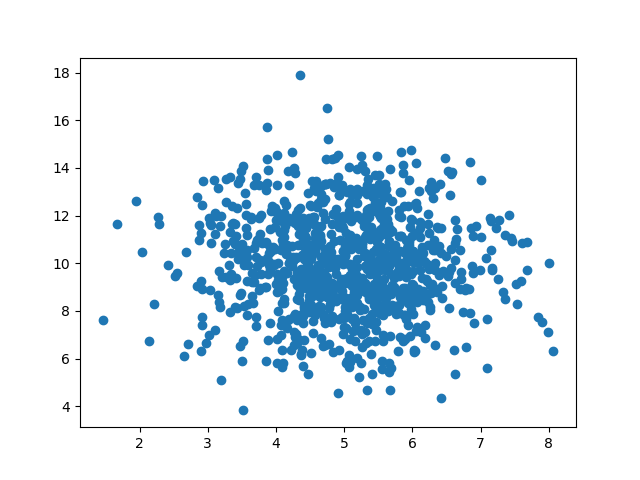
#Three lines to make our compiler able to draw: import sys import matplotlib matplotlib.use('Agg') import numpy import matplotlib.pyplot as plt x = numpy.random.normal(5.0, 1.0, 1000) y = numpy.random.normal(10.0, 2.0, 1000) plt.scatter(x, y) plt.show() #Two lines to make our compiler able to draw: plt.savefig(sys.stdout.buffer) sys.stdout.flush()