執行 ❯
獲取你自己的Python伺服器
×
更改方向
更改主題,深色/淺色
前往 Spaces
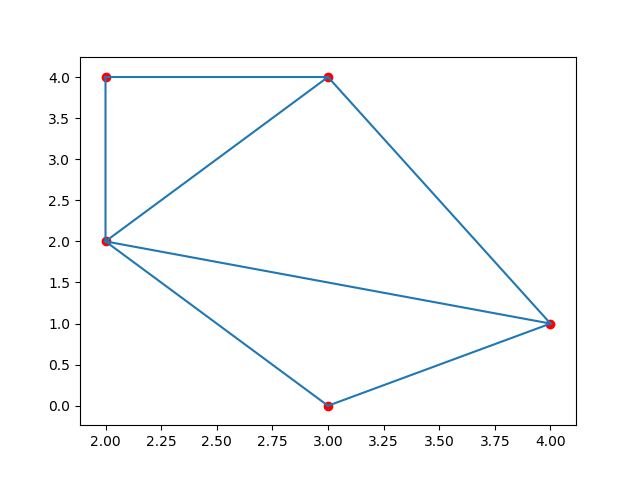
#Three lines to make our compiler able to draw: import sys import matplotlib matplotlib.use('Agg') import numpy as np from scipy.spatial import Delaunay import matplotlib.pyplot as plt points = np.array([ [2, 4], [3, 4], [3, 0], [2, 2], [4, 1] ]) simplices = Delaunay(points).simplices plt.triplot(points[:, 0], points[:, 1], simplices) plt.scatter(points[:, 0], points[:, 1], color='r') plt.show() #Two lines to make our compiler able to draw: plt.savefig(sys.stdout.buffer) sys.stdout.flush()